Data Report Generation
Introduction
There are two ways to create reports on Otonomo's data platform: via the report APIs and via the Platform UI. The latter is covered by this document. For more information on report creation via API, use the API References here.
Creating reports via the Platform is a great way to issue reports for those who prefer not to code.
Developers may also find the UI useful as it provides a code snippet of the API call used for generating the report, which can save development time.
There are two ways to generate reports in the Platform: from within the Fleet workspace or in the Reports section of the platform.
Reports
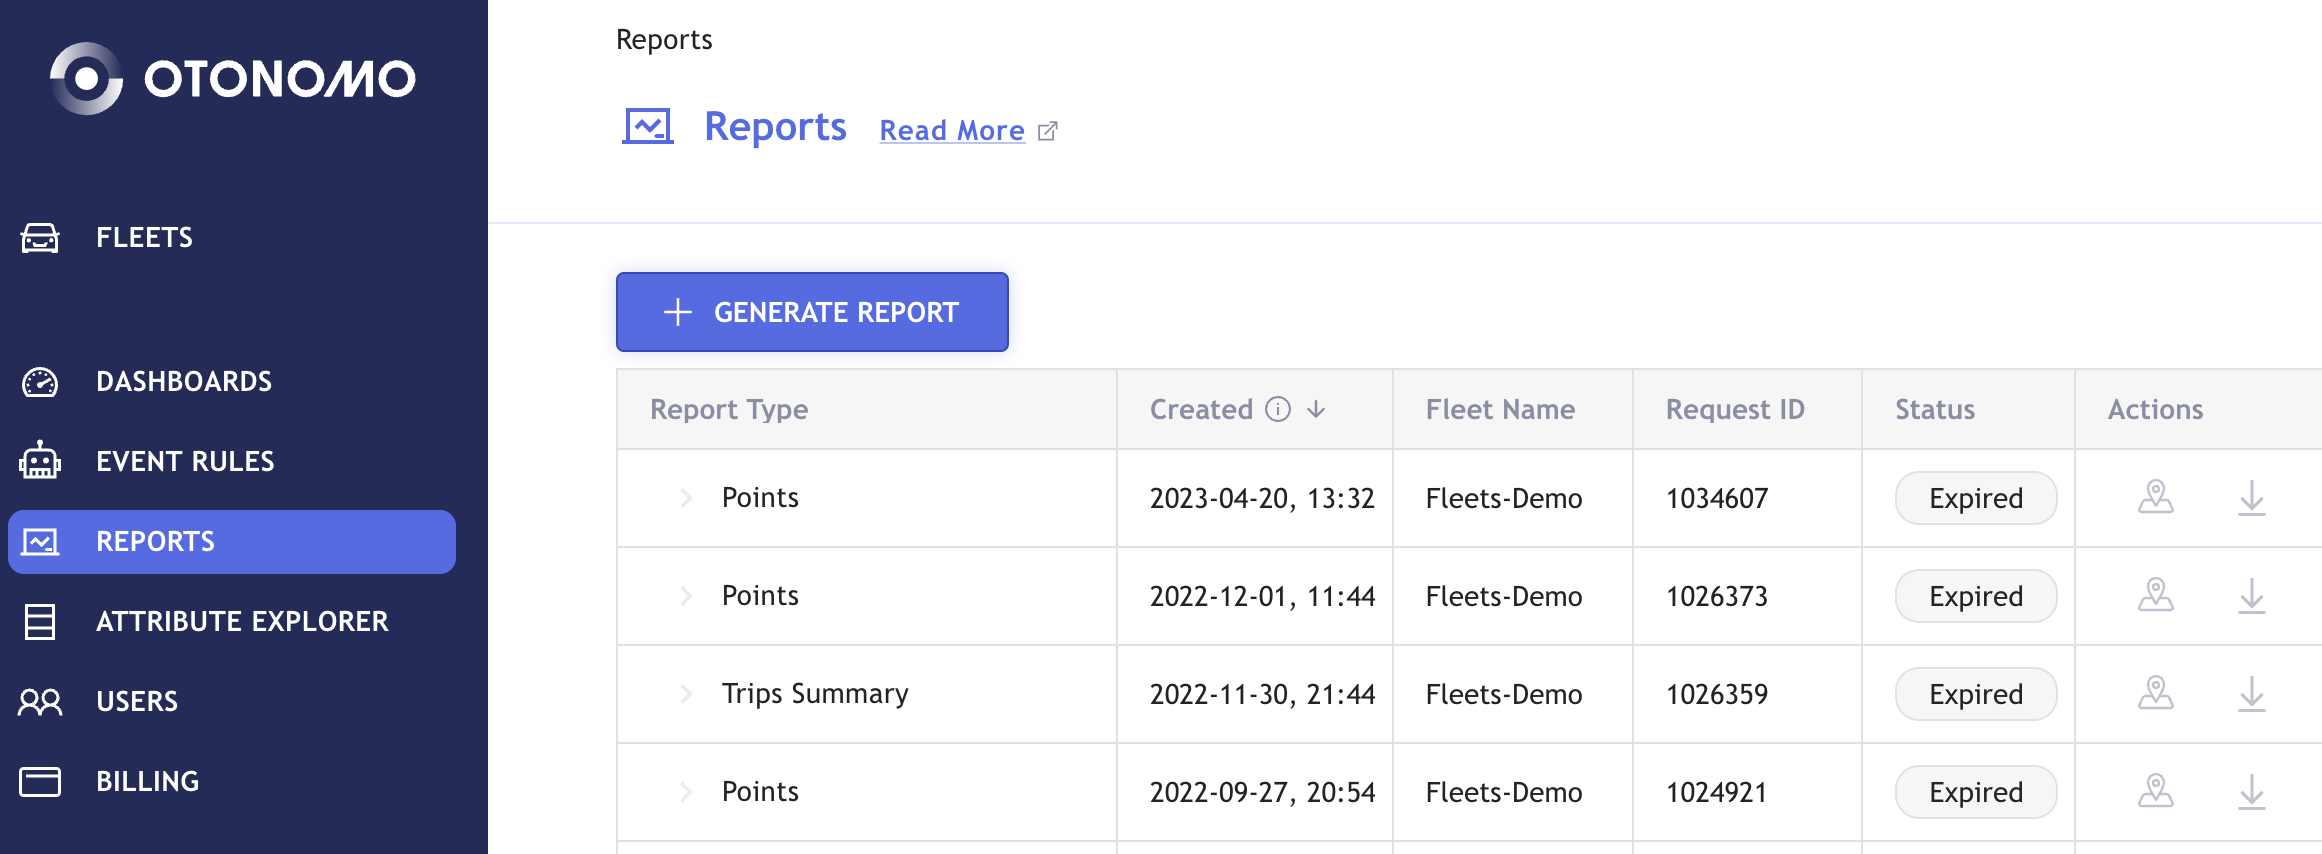
To generate a report from the Reports section, click on 'Reports' in the left-hand menu. Then click the "Generate Report" button.
Fleet Workspace
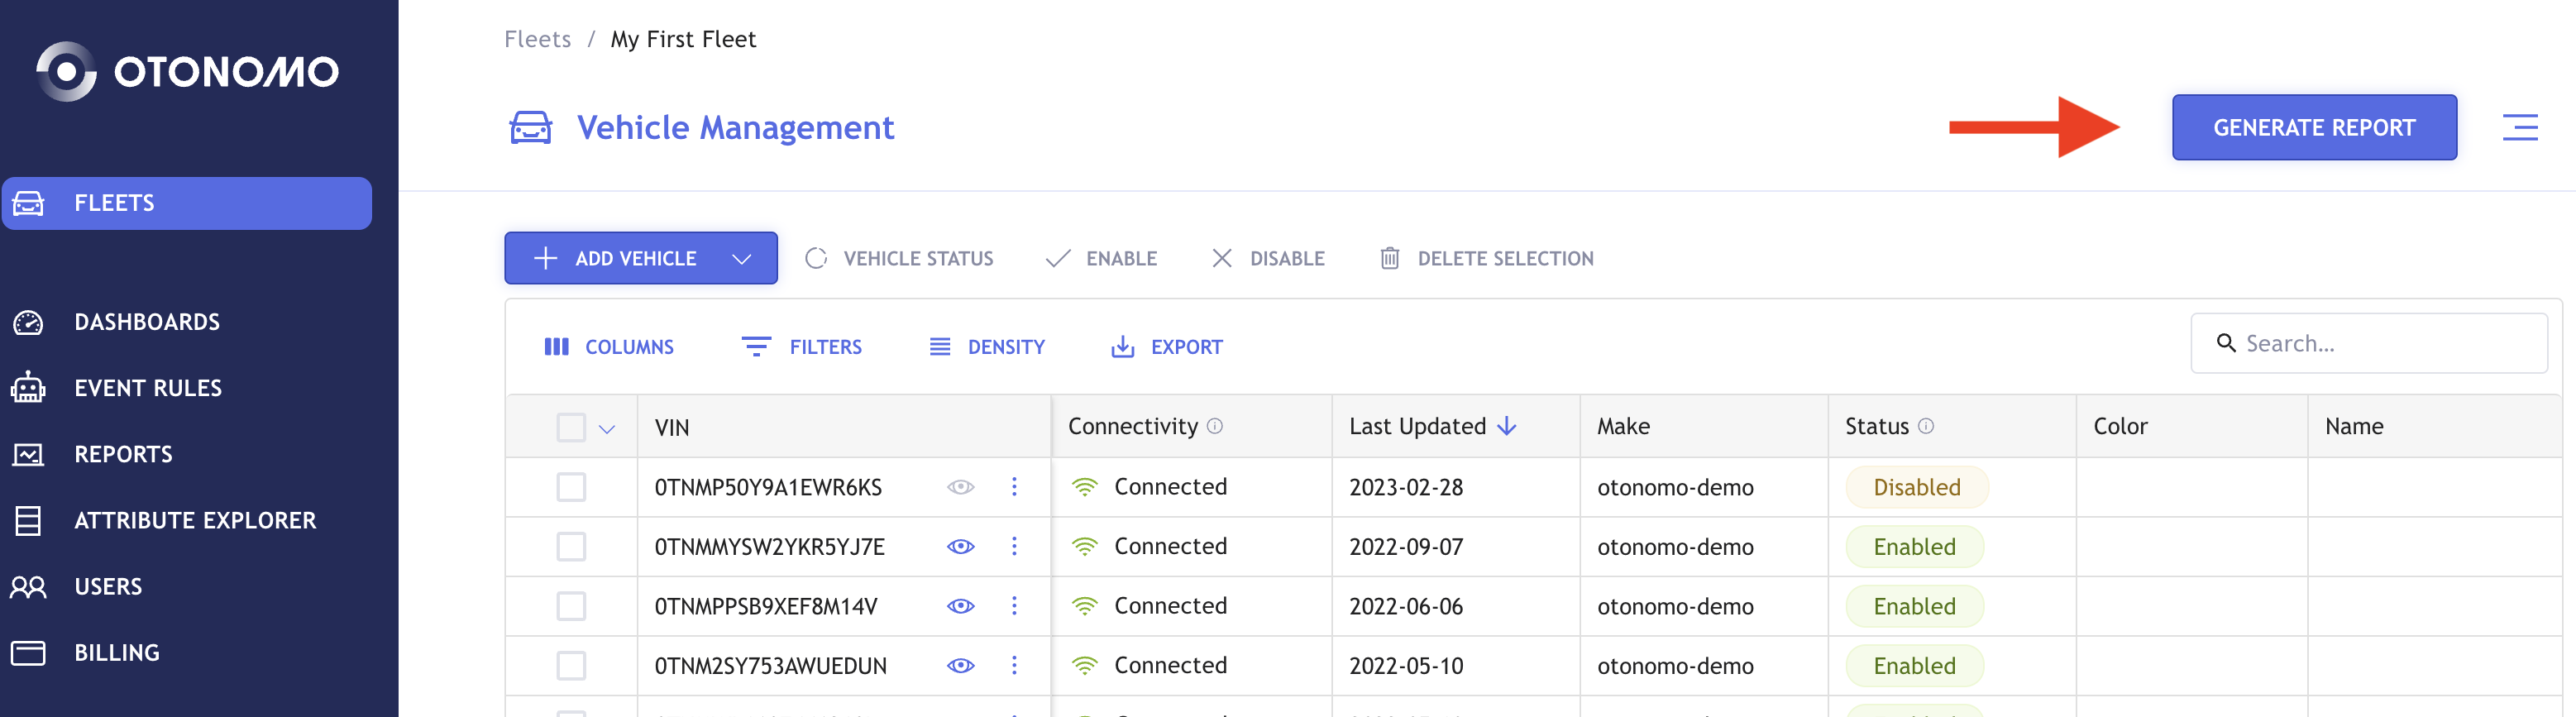
Select the Fleet for which you wish to create the report. Then, click the "Generate Report" button.
Report Generation
Once in the Report Generation screen, select the Fleet for which you wish to run the report. If you accessed this screen from the Fleet workspace, the fleet will automatically be selected.
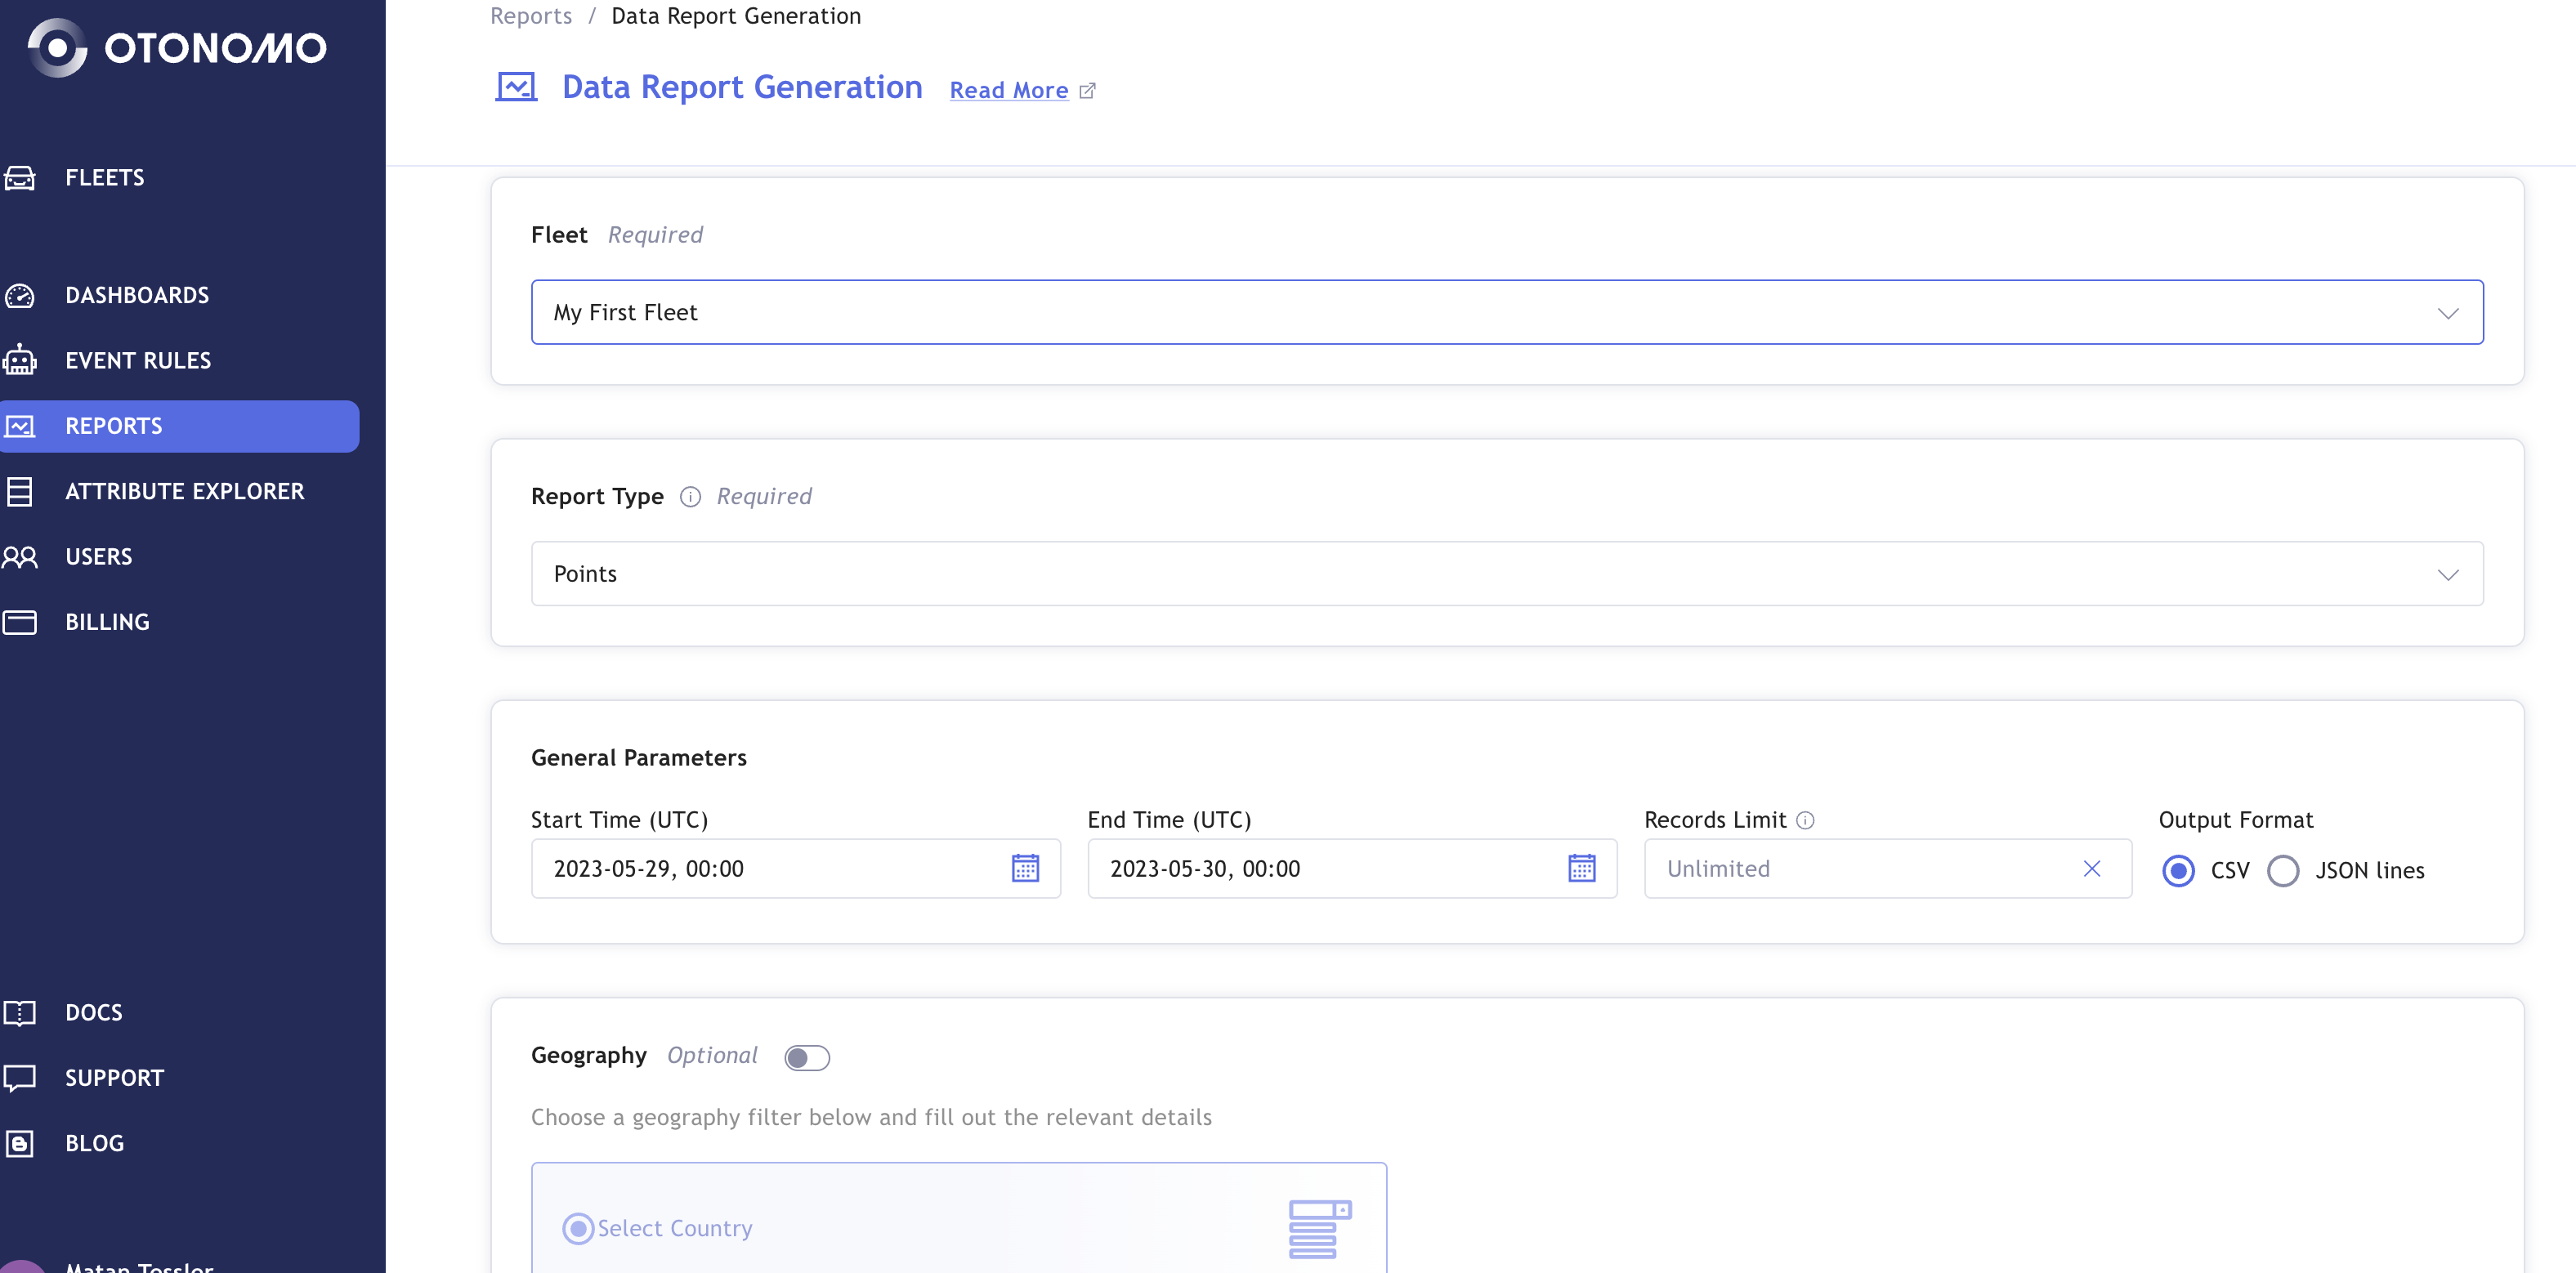
In order to generate a report, fill out the following details:
- Select the relevant Report type.
- Select Start Time and End Time.
- There are additional optional filters that can be used:
- Limit the number of records for the report. Note: When you place a record limit, the data will not necessarily be spread evenly over time or locations.
- Geography selection:
Toggle the 'Optional' button and you can either:- Select Countries, States, and Cities via the dropdown. Please note: you must select at least one country.
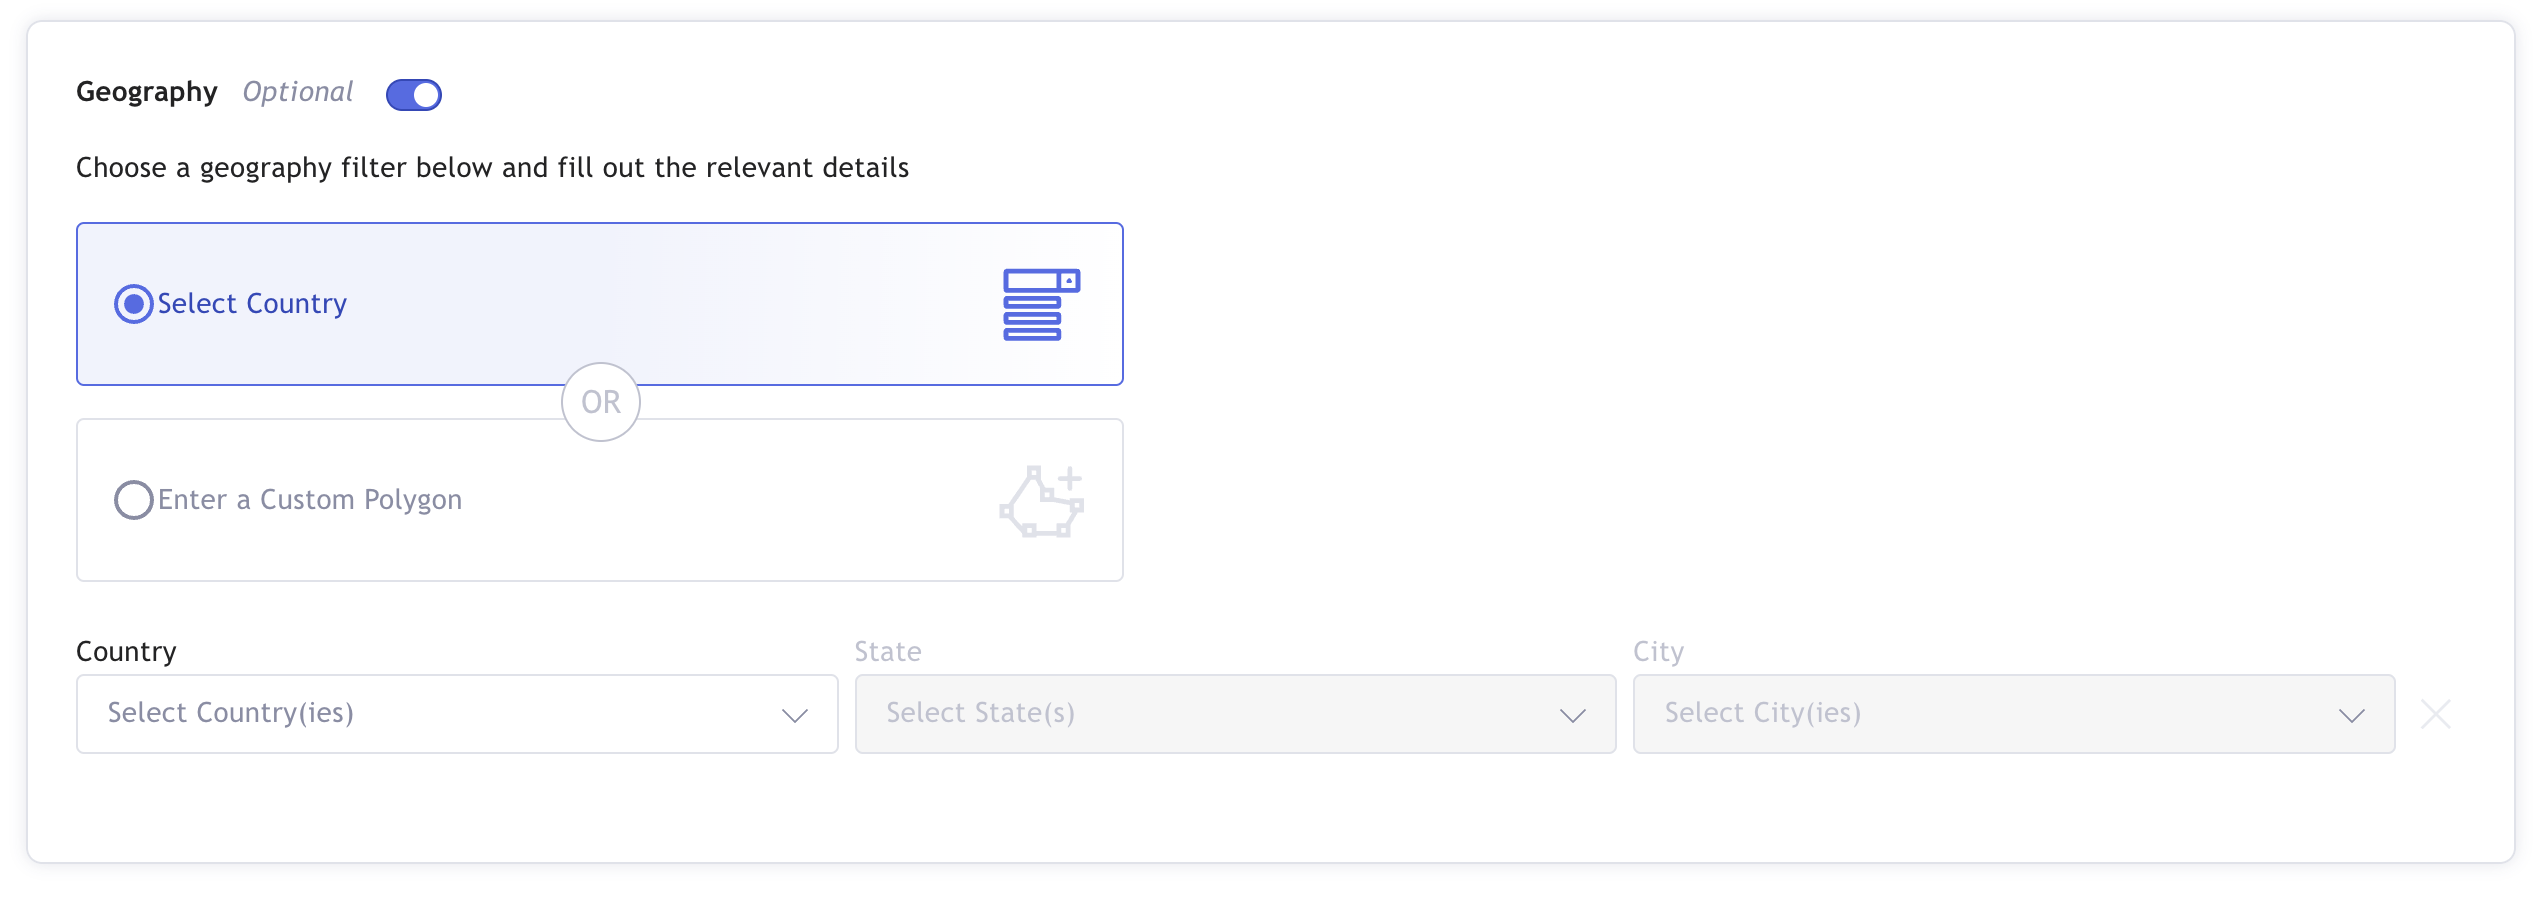
- Draw a polygon on the map - by clicking on the "Draw on Map" button on the left side of the map:
- Select Countries, States, and Cities via the dropdown. Please note: you must select at least one country.

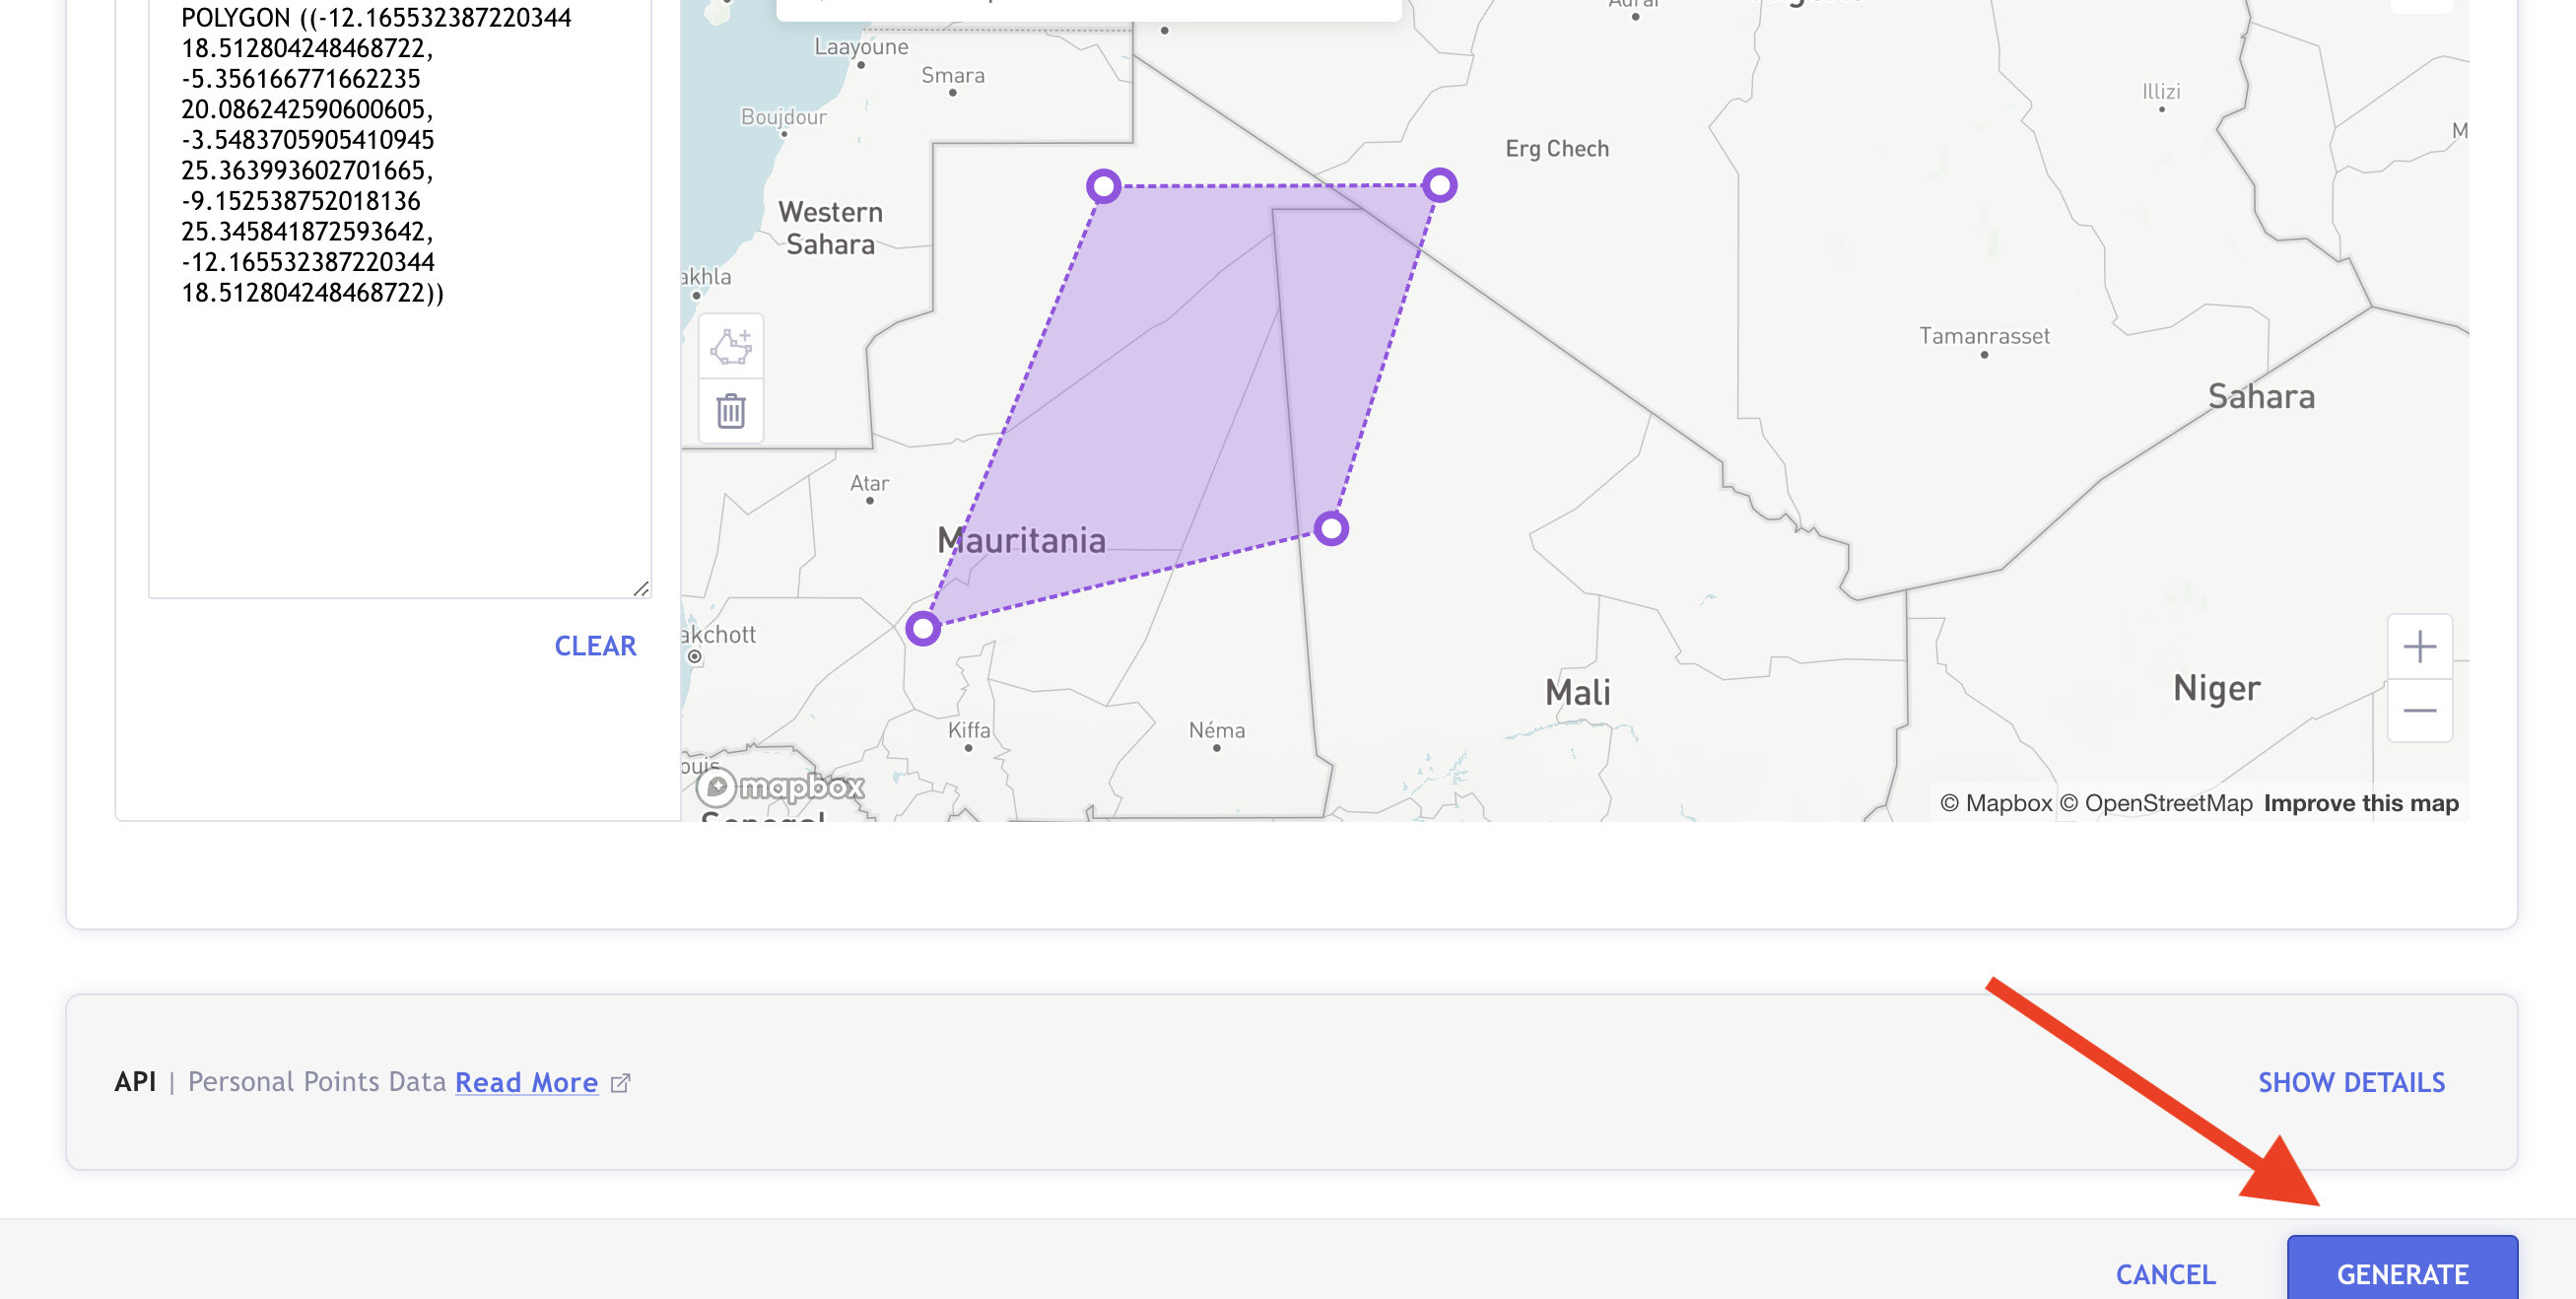
or by pasting a predefined WKT on the text box - left to the map:

How to create the polygon?
- Find the location in which you want to draw the polygon by searching it in the search bar.
- Start drawing the polygon by pressing the purple polygon button on the left side.
- Keep adding points to your polygon until you covered the required area.
The polygon needs to have a minimum of 3 points. - When finished drawing the polygon, press on one of the purple dots to exit the drawing mode.
- You can edit the existing polygon by dragging any of the purple dots in any direction.
If additional points are required in the polygon, you will have to delete the current polygon and create a new one.
Using more than 1 polygon
Creating a report via the UI is limited to 1 polygon per report.
To create a report with more than a single polygon, create the report via our API - Fleet Points Data
You are now ready to create your report.
To start the report generation, press "Generate" button on the bottom of the page
You can see the status of the report in the "Reports" section. A report can be downloaded when the status is "Completed".
Report naming convention
When a report is downloaded, the generated CSV follows a naming convention.
The convention is as follow: ReportID_part-0000X-RequestID_YYYYMMDDTHHMMSS
Report ID - A unique report ID, generated with the report generation request
Part-000XX - Some reports might have multiple CSVs that assemble the full report. This field describes the current file part number. In case that the result is a single file, this field will be populated as Part-00001.
RequestID - A unique ID that is generated by our servers.
YYYYMMDDTHHMMSS - End date and time as submitted in the report request:
- Y - Year
- M - Month
- D - Day
- T - Time (Does not change)
- H - Hour
- M - Minute
- S - Second
Let's look at an example.
A report was submitted with the start date: August 1st, 2019 at 13:00 (1:00 PM), and the end date: August 1st, 2019 at 23:00 (11:00 PM).
The reportID of the request is 1358
{
  "report_status": "Ongoing",
  "request_id": 1358
}
In this case, the generated report file name will appear as follows:
1358_part-00001-ey50d43sadgdfa3_20190801T230000.csv
Duration of Report Availability
Reports are available for download for 6 months.
Data Retention
Historical data can be provided only for times when the requested vehicle (VIN) was in “Enabled“ status and data was available.
Data Availability Limitation
The data is saved for up to 3 years.
Report Filters
You can use the following filters when requesting data:
- List of VINs - in case the list is empty - data for all VINs will be returned
- From date / To date - mandatory fields
- Countries
- States
- Cities
- Polygon
- Maximum number of cars to return
- Records Limit - mandatory field
- Advanced filters - for more information contact [email protected]
See more examples here (https://docs.otonomo.io/reference/historical-data?showHidden=6c81a#undefined)
Updated 11 months ago