Data Report Generation
Introduction
There are two ways to create reports on Otonomo's data platform: via the report APIs and via the Self Serve Platform UI. The latter is covered by this document. For more information on report creation via API, use the following guide: Aggregated Data APIs
Creating reports via the UI is a great way to issue reports for those who prefer not to code.
Developers may also find the UI useful as it provides a code snippet of the API call used for generating the report, which can save development time.
If you have just created a new Workspace, then you are already in the relevant screen.
Otherwise, in order to generate a report follow these steps:
- Login to the platform
- Select the required Workspace on which you wish to create reports.
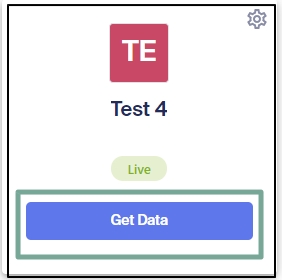
- Click the "Get Data" button:

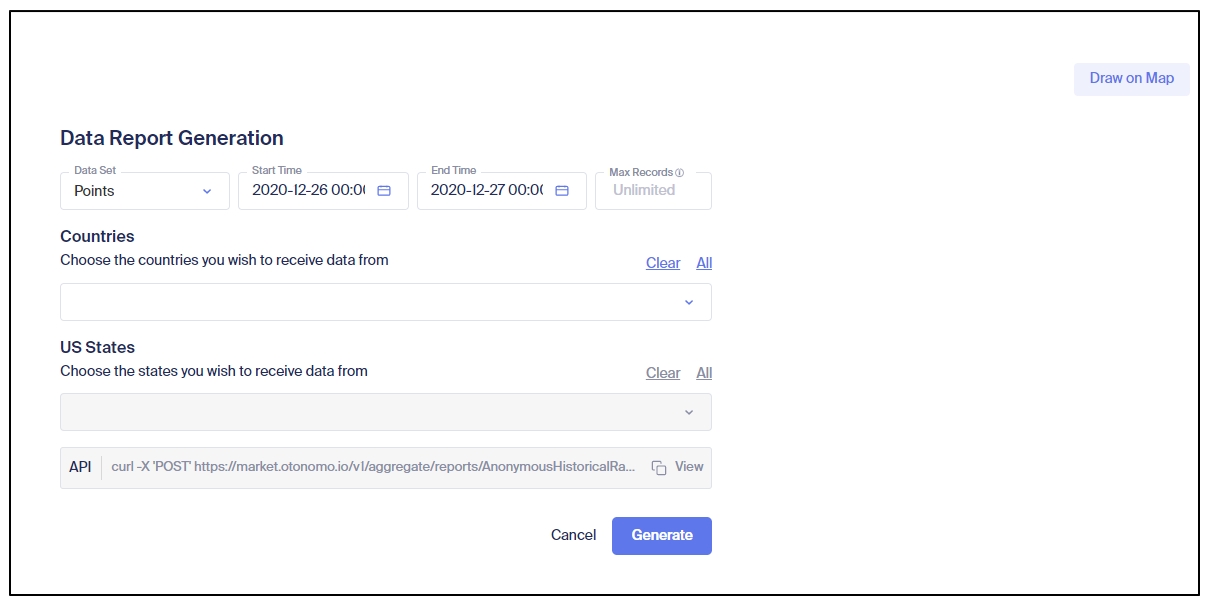
Get the following screen:

In order to generate a report fill out the following details:
(Please note: A Trial user has specific limitations. Read more about it here)
- Select the relevant Data Set.
- Select Start Time and End Time.
- Limit the number of records for the report. Note: When you place a record limit, the data will not necessarily be spread evenly over time or locations.
- Geography selection: you can either:
a. Select Countries (and States) via the dropdown. Please note: you must select at least one country.
b. Draw a polygon on the map - by clicking on the "Draw on Map" button on the top right corner.

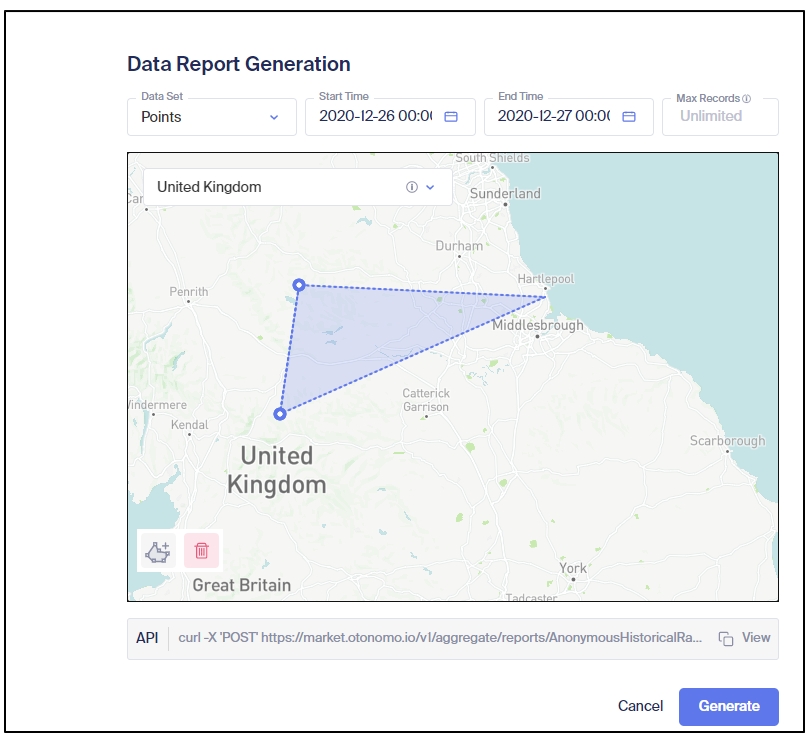
How to create the polygon?
- Find the location in which you want to draw the polygon by searching it in the search bar.
- Start drawing the polygon by pressing the blue polygon button on the bottom left
- Keep adding points to your polygon until you covered the required area.
The polygon needs to have a minimum of 3 points. - When finished drawing the polygon, press on one of the blue dots to exit the drawing mode.
- You can edit the existing polygon by dragging any of the blue dots in any direction.
If additional points are required in the polygon, you will have to delete the current polygon and create a new one.
Using more than 1 polygon
Creating a report via the UI is limited to 1 polygon per report.
To create a report with more than a single polygon, create the report via our API - Aggregated Raw Data
You are now ready to create your report.
To start the report generation, press the blue "Generate" button

Please Note!
Once you generate a report, you will be charged according to Otonomo's pricing.
Once the request for a report has been submitted, we will work on generating your report.
You can see the status of the report in the "Reports" section.
A report can be downloaded when its status is "Completed".
In the API section you are provided with the actual API used to create the report, so it can be used to generate future reports.
To use it again, you will only need to modify the start date and end date.
You can copy the resulted API command by using the copy button:

Report naming convention
When an aggregated report is downloaded, the generated CSV follows a naming convention.
The convention is as follow: ReportID_part-0000X-RequestID_YYYYMMDDTHHMMSS
Here is the explanation of each part:
Report ID - A unique report ID, generated with the report generation request
Part-000XX - Some reports might have multiple CSVs that assemble the full report. This field describes the current file part number. In case that the result is a single file, this field will be populated as Part-00001.
RequestID - A unique ID that is generated by our servers.
YYYYMMDDTHHMMSS - End date and time as submitted in the report request:
- Y - Year
- M - Month
- D - Day
- T - Time (Does not change)
- H - Hour
- M - Minute
- S - Second
Let's look at an example.
A report was submitted with the start date: August 1st, 2019 at 13:00 (1:00 PM), and the end date: August 1st, 2019 at 23:00 (11:00 PM).
The reportID of the request is 1358
{
  "report_status": "Ongoing",
  "request_id": 1358
}
In this case, the generated report file name will appear as follows:
1358_part-00001-ey50d43sadgdfa3_20190801T230000.csv
What is the duration for which the report is downloadable?
Reports are available for download for 30 days.
Updated 12 months ago
